Elasticsearch provides over 80 different aggregations. To help you see the forest for the trees, every month, this blog series highlights a different aggregation.
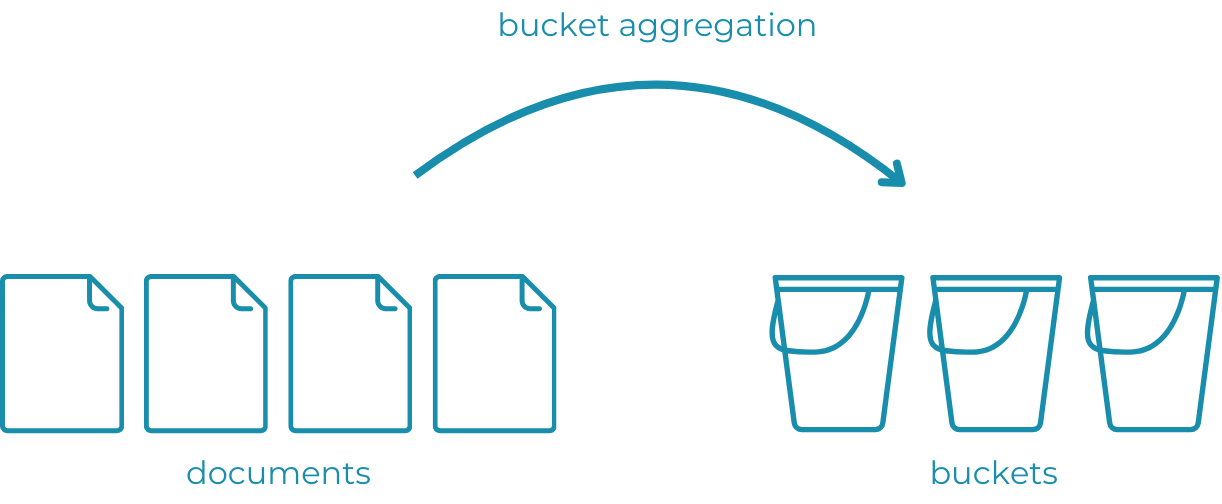
Elasticsearch provides a variety of metrics and bucket aggregations to help you analyze your data. For instance, if you want to analyze data over time, you can use a date histogram bucket aggregation. This aggregation groups your data into configurable time intervals, called “buckets”. For each of these time interval buckets, you can calculate one or more metrics.

For example, for the books dataset, you can use a bucket aggregation to group documents by their publication year. This results in a date histogram showing how many books were published each year:

Each of the bars in this histogram represents a yearly bucket. The height of each bar corresponds to the number of documents that have a publication_date in that year, reflecting the number of books published during that year. To generate this histogram, use the following request:
GET books/_search
{
  "size": 0,
  "aggs": {
    "publication_year": {
      "date_histogram": {
        "field": "publication_date",
        "calendar_interval": "year"
      }
    }
  }
}
What if you would like to further analyze these buckets? For instance, you might want to know which year had the fewest or most books published. One way to do this is by manually iterating over each bucket and keeping track of the buckets with the minimum and maximum values. But you can also let Elasticsearch do it for you, using pipeline aggregations.
Pipeline aggregations operate on the results of other aggregations, rather than directly on documents. For example, the min bucket pipeline aggregation finds the buckets with the minimum value for a specific metric. Likewise, the max bucket pipeline aggregation returns the bucket with the maximum value.

The corresponding request looks like this:
GET books/_search
{
  "size": 0,
  "aggs": {
    "publication_year": {
      "date_histogram": {
        "field": "publication_date",
        "calendar_interval": "year"
      }
    },
    "min_year": {
      "min_bucket": {
        "buckets_path": "publication_year>_count"
      }
    },
    "max_year": {
      "max_bucket": {
        "buckets_path": "publication_year>_count"
      }
    }
  }
}
Compared to the previous request, the are two additional aggregations under the aggs clause: min_bucket and max_bucket. Both aggregations have been configured with a buckets_path. This is the path to the ID of the aggregation that generates the buckets on which the pipeline aggregation should operate (publication_year). You also need to specify the metric. Here, that’s the _count metric , which represents the document count for each bucket.
The response shows that the year 2006 saw the most books published, with a count of 1700:
...
    "max_year": {
      "value": 1700,
      "keys": [
        "2006-01-01T00:00:00.000Z"
      ]
    }
...
Meanwhile, the min_bucket aggregation returns a series of years in which, according to the dataset, no books were published at all.
Read more
- Documentation for pipeline aggregations
- Documentation for the min bucket aggregation
- Documentation for the max bucket aggregation
Published: March 18, 2025 by Abdon